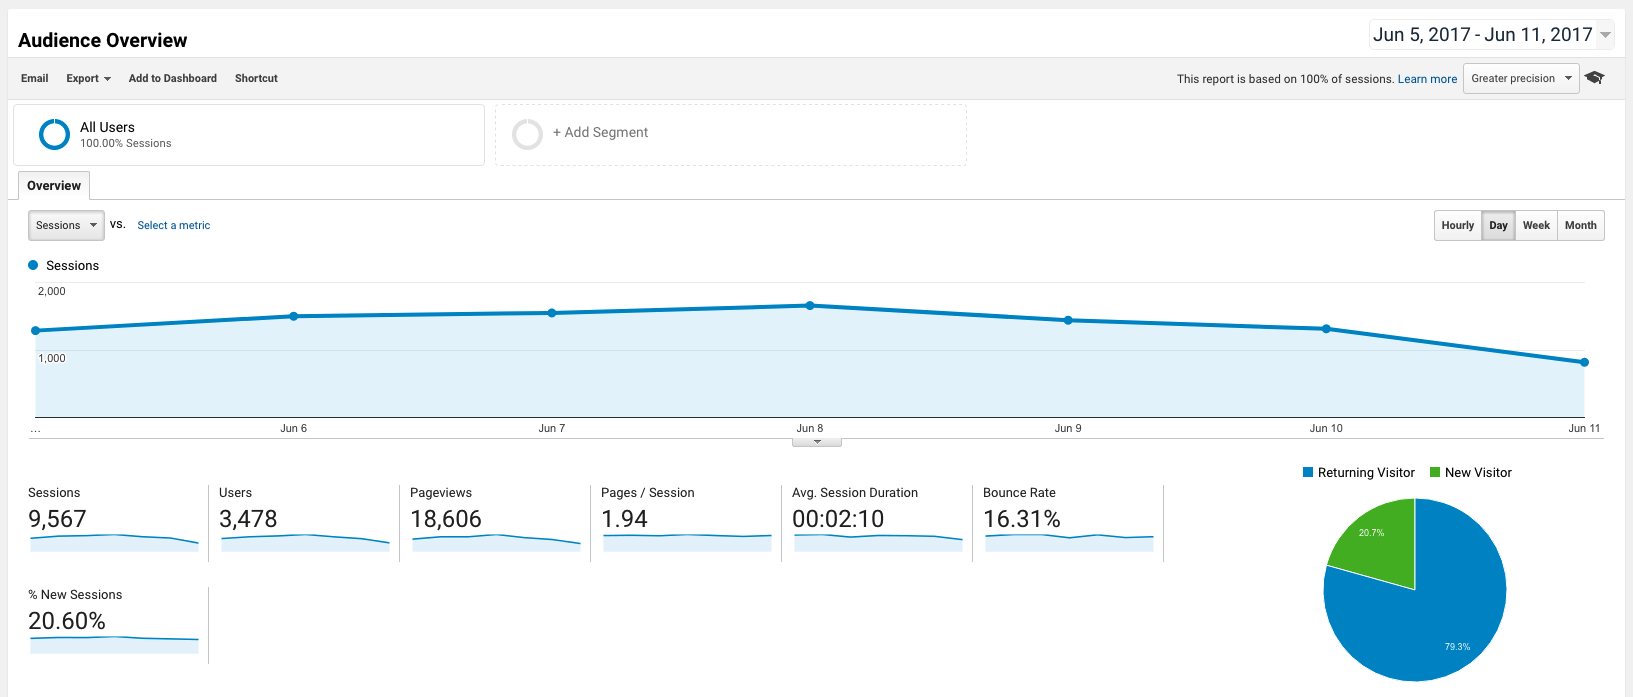
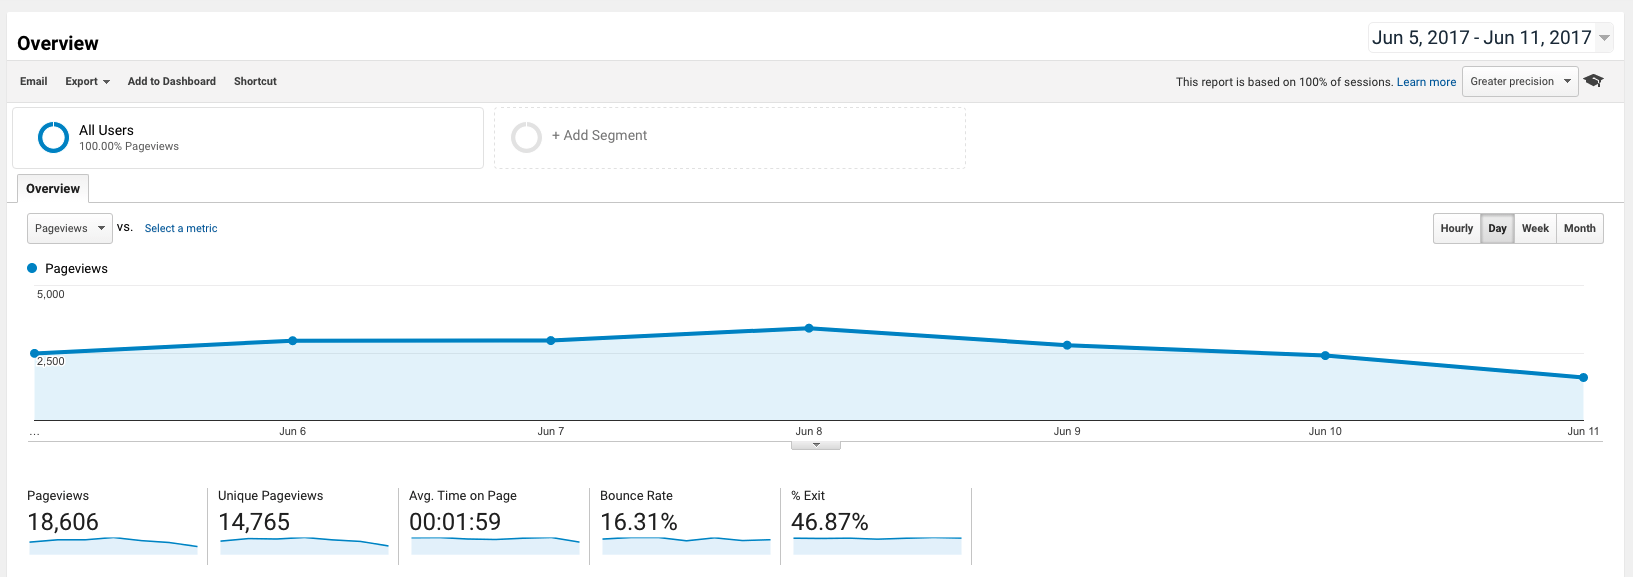
Analytics are a powerful way to track traffic patterns on your website. Web analysis can be an endless pit; but keeping on top of these basic statistics should keep you ahead of the game.
Google Analytics is one of the most powerful analytical tools available. The good news is, it is free and can easily be installed on your website, including on a STAAH InstantSite website. The terms and sections we mention in this blog are based on Google Analytics. If you’re using another analytical tool, these terms may vary slightly, but the end objective of both is same – to inform you about your website’s traffic and performance.
Google Analytics divides up the data into four distinct sections – Audience, Acquisition, Behaviour and Conversions.

Audience Section
Here you’ll find everything you need to know about your users (also known as visitors), including their demographics, general interests, location, language, how often they visit your website & what they do, and technology used to get to the website.
The audience section report is the most basic overview you can get of what’s happening on your website.
Sessions: This shows the number of times your site is visited. Session duration is an indication of how long a user spent on your site – a low session time could indicate that you content is not engaging or the user was unable to find what they wanted. Multiple page views (a statistic available in this section) in a short session time could be a confirmation of this. Alternatively when users explore multiple pages in one long session, it indicates engagement.
Users (or unique users) are the number of distinct users/visitors who request pages from your website during a specific period, no matter how many times they visit. New users are those who’ve visited your site for the first time, while a returning user has been to your website before – the latter is a good indicator of your website’s loyal following.
Bounce rate: A bounce is when a visitor arrives to your website and does one of the four actions (within 10-30 seconds, depending upon the set or adjusted bounce rate): clicked the button back, closed the browser, typed a new URL, or did nothing (session times out after 30 minutes).
In the hospitality industry, a bounce rate of under 50% is considered good. If it’s higher, you need to investigate what user expectations are unmet – is it the content, design or page load time?
Interests, Geo & Demographics: This gives you insights into your users. Who are they, where they are from and what they like.
You can target your website content and marketing plans to this audience to see higher conversions – i.e. bookings.

Acquisition Section
This section tells you everything you need to know about what drove users to your website – email, direct (when someone types your website URL directly into Google), organic search, social cannels, paid search and referrals (other websites directing users to your website).
Your campaign results (AdWords, Display or Social) are available in this section.

Behaviour Section
These reports will tell you everything you want to know about your content.
Entry & exit pages: Entry page is the first page a user visits on your website while the exit page is the last. The behavior section provides you an overview of top pages on your website, including entry and exit pages.
Site speed: How fast or slow do your web pages load? It is critical to ensure you have a fast loading website – both from a search and user perspective.

Conversion Section
If you set up Goals within your Google Analytics, you can see how many conversions your website has received and what URLs they happened upon. You can also see the path that visitors took to complete the conversion. If you’re a Google Analytics and website management novice, we suggest leaving this till you’re well versed with the other aspects of the tool.
